Introduction
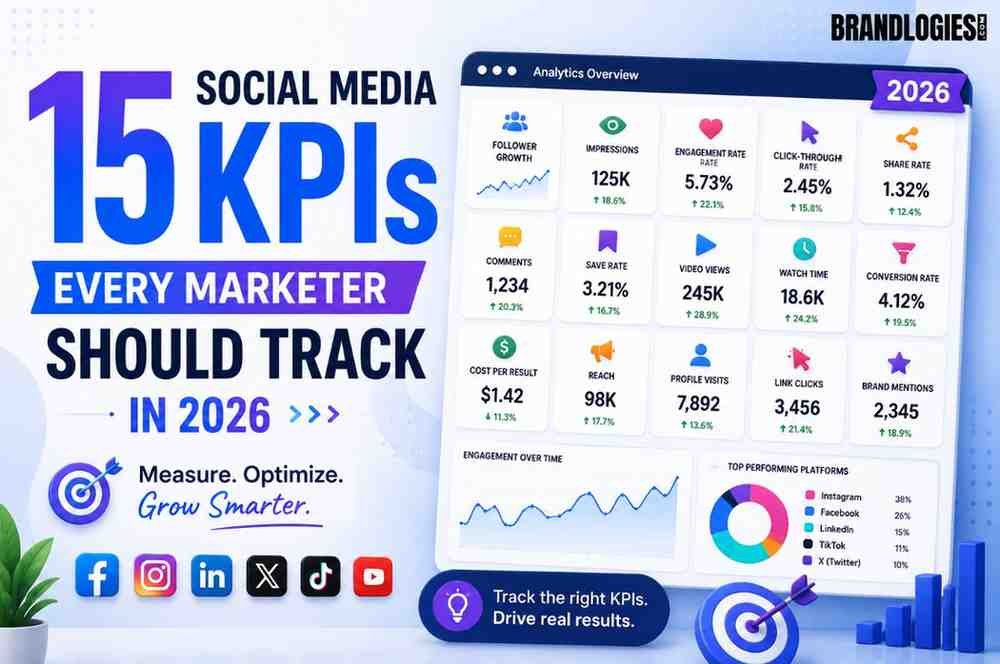
Social media KPIs in 2026 fall into six practical categories — engagement, awareness, conversions, ROI, customer care, and content performance — and tracking the right mix from each one is what separates marketers proving real business impact from those just screenshotting a post with a lot of likes. The distinction that matters most: a metric tells you what happened, while a KPI ties that number to an actual business goal. Follower count and raw likes are metrics most teams still track, but on their own they say very little about whether social media is actually driving revenue, retention, or brand growth. Below are 15 KPIs worth building into your 2026 reporting, organized by what stage of the funnel or business goal each one actually answers.
Engagement KPIs
1. Engagement Rate
Engagement rate measures how actively your audience interacts with your content — comments, shares, saves, and clicks, not just passive likes. It’s typically calculated as total engagements divided by total followers or total reach, multiplied by 100. Many marketers now favor calculating it against actual reach rather than follower count, since that gives a clearer read on how people beyond your existing followers respond to your content.
2. Reply Time
Reply time tracks how quickly your team responds to comments, messages, and mentions. Consumers increasingly expect fast, personalized responses on social media, and slow reply times can quietly erode trust before a purchase decision is ever made.
3. Sentiment Trend
Sentiment tracking looks at whether mentions of your brand skew positive, negative, or neutral over time. It catches shifts in public perception long before they show up in harder metrics like conversions or churn.
Awareness KPIs
4. Reach
Reach counts the number of unique people who saw your content. It’s a foundational awareness metric, though it works best paired with engagement rather than viewed in isolation.
5. Impressions
Impressions count total content views, including repeat views from the same person. Compared side by side with reach, impressions can reveal how often your existing audience is seeing a piece of content versus how far it’s spreading to new people.
6. Share of Voice
Share of voice measures how much of the overall online conversation in your industry mentions your brand compared to competitors. It’s inherently competitive — tracking it requires social listening tools, but it forces a broader view of market position rather than just your own account’s performance.
Expert Tip
Don’t report share of voice without also tracking what competitors are doing well that you aren’t. The number itself tells you where you stand; the content and topics driving competitor mentions tell you what to actually change.
Conversion KPIs
7. Click-Through Rate (CTR)
CTR measures how often people who see your content actually click through to your website or landing page. It’s one of the clearest bridges between social content and measurable business action.
8. Conversion Rate
Conversion rate tracks what percentage of those clicks actually complete a desired action — a purchase, signup, or form submission. This is where social media stops being about attention and starts being about business outcomes.
9. Cost Per Lead
Cost per lead measures total spend — including ad spend, content production, and platform or tool fees — divided by the number of qualified leads generated. It’s essential for justifying budget increases with real numbers rather than vanity metrics.
ROI and Business Impact KPIs
10. Customer Acquisition Cost (CAC)
CAC calculates the total cost of acquiring a new customer through social media specifically, factoring in both ad spend and the internal resources behind your content and campaigns.
11. Revenue Per Post (or Campaign)
For brands running attributable social campaigns, tracking revenue tied directly to specific posts or campaigns turns social media from an activity into a measurable investment, making it far easier to identify which content formats are actually worth repeating.
12. Earned Media Value (EMV)
EMV estimates the dollar value of organic exposure your brand receives through unpaid mentions, shares, and interactions, typically calculated using a cost-per-impression or cost-per-engagement benchmark. It’s a useful way to translate word-of-mouth reach into terms a finance team can evaluate alongside paid media spend.
Customer Care KPIs
13. First Response Time on Support Inquiries
Separate from general reply time, this tracks how quickly customer service-specific messages get a first response. Fast, helpful replies on social support channels increasingly shape whether a customer sticks around after a bad experience.
14. Resolution Rate
Resolution rate measures what percentage of customer issues raised on social platforms get fully resolved through that channel, rather than escalating elsewhere or going unanswered.
Content Performance KPIs
15. Content Format Performance
This tracks which formats — video, carousel, static image, live content — actually drive engagement and conversions for your specific audience, rather than assuming one format performs universally well. Comparing performance by format regularly helps redirect production effort toward what’s genuinely working.
Quick-Reference KPI Table
| Category | KPIs to Track |
|---|---|
| Engagement | Engagement rate, reply time, sentiment trend |
| Awareness | Reach, impressions, share of voice |
| Conversions | CTR, conversion rate, cost per lead |
| ROI | CAC, revenue per post, earned media value |
| Customer Care | First response time, resolution rate |
| Content Performance | Format-level performance comparison |
Common Mistakes to Avoid
- Tracking follower count as a primary success metric, when it’s widely considered a vanity metric unless the audience is genuinely active and aligned with your goals
- Reporting engagement without tying it to a business goal, missing the real distinction between a metric and a KPI
- Ignoring customer care metrics, even though response speed increasingly influences purchase decisions
- Trying to track too many KPIs at once, instead of starting with three to five tied directly to current business priorities
- Comparing performance without benchmarks, since a number alone means little without context on whether it’s above or below a reasonable standard
Many businesses work with experienced digital marketing agencies like Brandlogies to build a KPI dashboard that ties social media performance directly to broader marketing and revenue goals.
Building a KPI Framework That Actually Drives Decisions
The goal in 2026 isn’t a dashboard full of every possible number — it’s a focused set of KPIs that each answer a specific decision question, like whether to increase spend, shift creative direction, or change platforms. Start with three to five primary KPIs tied to your current business priorities, define a consistent measurement window, and expand your tracking as your team’s measurement maturity grows. The social teams seeing real results in 2026 aren’t the ones with the most data — they’re the ones asking whether their numbers are actually making the business money, and building their reporting around that question.

Frequently Asked Questions
1. What’s the difference between a social media metric and a KPI?
A metric is any measurable data point, like likes or impressions; a KPI is a metric specifically tied to a business goal.
2. Is follower count still a useful KPI in 2026?
Not on its own — it’s generally considered a vanity metric unless paired with engagement, retention, and relevance to your actual goals.
3. How many social media KPIs should I track at once?
Most teams do best starting with three to five primary KPIs tied to current priorities, expanding gradually as needed.
4. What KPI best shows social media’s ROI?
Customer acquisition cost and revenue per post are among the clearest ways to tie social activity directly to business outcomes.
5. How is engagement rate calculated?
Typically as total engagements divided by total followers or total reach, multiplied by 100.
6. Why does share of voice matter?
It shows your brand’s market position relative to competitors, not just your own account’s isolated performance.
7. Do customer care metrics count as social media KPIs?
Yes, reply time and resolution rate increasingly influence brand perception and purchase decisions.
8. What tools help track social media KPIs?
Platform analytics, tracking links, UTM parameters, and dedicated social analytics tools can all help consolidate KPI tracking.
Read Also – What Is the 70/20/10 Rule for Social Media?